
AI Marketing Dashboards
Reporting Consumes Teams
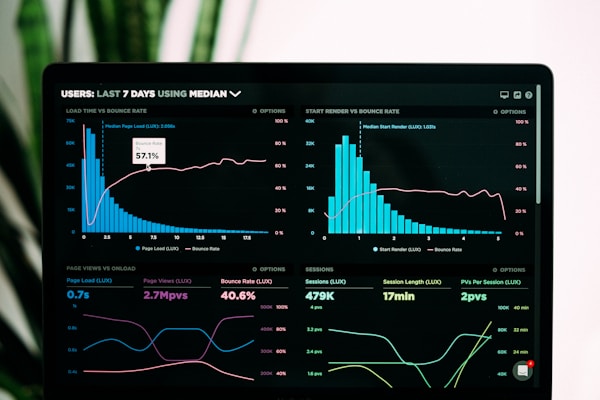
Marketing teams spend hours assembling reports nobody reads. AI dashboards assemble themselves and explain the story in plain language. The ten dashboards below cover every reporting question a marketing team gets asked.
1. All-in-One Marketing Scorecard
Pull every channel into a single scorecard with traffic, leads, and revenue side by side so the full picture fits on one screen. Fragmented reporting is why teams cannot answer the simplest questions about what is working. Give each metric a trend arrow and a plain-language note, and the scorecard becomes the meeting's agenda.
2. Paid-Ads Performance Dashboard
Show spend, impressions, CTR, and CPA across Meta, Google, and TikTok in one view, refreshed automatically. Ad managers rebuild these views in spreadsheets every week, and manual rebuilding is where errors creep in. Add a comparison to the previous period and a weekly digest so the numbers get read, not just collected.
3. SEO Rankings Dashboard
Track keyword positions, search volume, and organic traffic over time, with ranking movements flagged as wins or losses. SEO moves slowly, so the dashboard's job is making the trend visible before clients lose patience. Break it down by keyword cluster so teams see whether the strategy is working beyond any single term.
4. Social Analytics Dashboard
Combine follower growth, engagement, and best-performing posts across platforms in one feed. Every platform reports its own vanity metrics, which makes cross-platform comparison impossible. Rank posts by engagement rate instead of raw likes, and let teams filter by date range or campaign to spot what content drives results.
5. Email Metrics Dashboard
Monitor opens, clicks, unsubscribe rates, and revenue per send across all campaigns and automated flows. Email performs best of any channel but is often the least reported, because the platforms bury the useful numbers. Surface deliverability and revenue per subscriber prominently, since those two tell the real story.
6. Sales-Funnel Dashboard
Visualize leads at each funnel stage from first touch to closed deal, with conversion rates between every step. Funnel reporting exposes where deals stall, and most teams only see the start and the end. Add a time dimension so users see how long deals take at each stage, which is where the pipeline bottlenecks hide.
7. Content Performance Dashboard
Score every blog post, video, and asset by traffic, engagement, and contribution to leads so you know what to double down on. Content teams publish on intuition because no one tracks performance systematically. Cluster content by topic and format, and highlight the top performers worth refreshing or repromoting.
8. Budget vs ROI Tracker
Compare planned spend against actual across channels, and pair it with the revenue each channel returns. Budget overspend usually surfaces in accounting, months after the fact, when it is too late to fix. Show burn rate in real time with the projected end-of-quarter number, and flag any channel that is spending without returning.
9. Competitor Tracking Dashboard
Monitor competitor traffic, ad presence, pricing, and social activity in one view so you always know what they are doing. Keeping tabs on rivals is usually manual and anecdotal. Deliver a weekly change-log style report of what competitors shifted, which keeps subscribers coming back to the dashboard.
10. Executive Summary Reports
Generate a one-page monthly narrative — what happened, why, and what is next — that a CEO can read in two minutes. Executives do not want dashboards; they want the story with the numbers attached. Automate the draft, let the marketing lead add context, and this single feature becomes the reason the tool gets renewed.
Sell the "Story" Feature
The differentiator is the AI "what happened this month" narrative — executives love it, teams adopt it, churn drops. Lead with it in every demo.
Dashboards need verified code — OpeClaud reviews it
Try OpeClaud Ai Free →